A hard summer rain on the Winona Lake watershed puts water in motion across 18,730 acres, a figure published by the Lilly Center for Lakes & Streams, and most of that water is headed for the lake. Winona sits at the downstream end of its watershed, so a storm that passes overhead in an hour keeps arriving through the inlets for days afterward.
The path from cloudburst to lake
Rain that lands on the watershed's fields, yards, roofs, and streets splits two ways. Some of it soaks into the soil. The rest becomes runoff and moves downhill across whatever surface it landed on. In town, storm drains collect it from streets and parking lots and pipe it toward the nearest channel. In the surrounding farmland, roadside and agricultural ditches do the same work in the open.
Four named ditch systems concentrate that flow on its way to the lake, all traced on the watershed map. Peterson Ditch, the southern branch, drains agricultural and residential land south of the lake and enters on the southwest side; it carries enough sediment that it has its own restoration story, covered in why Peterson Ditch matters. Keefer-Evans Ditch flows north through Lake John. Wyland Ditch connects Sharon, Sheely, and Wyland lakes to Winona. Tennant Ditch is a southeastern tributary near Tennant and Sellers lakes.
The lake is the low point of the whole system, which is why it receives everything the storm set moving. It is also a stop along a longer route: the water leaves through a single outlet, over the spillway of the dam on Eagle Creek, and continues to Walnut Creek and then the Tippecanoe River. Some of what a storm washes in settles to the lake bottom, and some travels on downstream.
What runoff carries
Moving water picks things up. The watershed page lists what commonly rides along: soil, and the phosphorus that binds to it; bacteria from pet waste, livestock, and failing septic systems; oil and road salt from pavement; grass clippings and fertilizer from lawns. Each behaves differently once it reaches the lake. Soil clouds the water and settles out as sediment. Phosphorus is plant food, and in a lake the plants it feeds are mostly algae. Bacteria are what the beach monitoring program tests for.
The Lilly Center's E. coli explainer describes the bacteria pathway plainly: "Rain collects E. coli from animal waste and disposes of it in the nearest body of water." E. coli lives in the digestive tracts of warm-blooded animals, and the explainer names birds, livestock, and humans as sources, with storm drains contributing. Only a few of its hundreds of varieties harm people, which is part of why the counts take some interpreting.
What the stream monitoring shows
The Lilly Center samples 14 area streams every other week, all year round, plus seven beaches during the summer, and updates its E. coli page weekly. Those stream results are the clearest illustration of how differently Winona's inlets can run on the same day.
Stream sample snapshot, October 1, 2026. The Lilly Center's E. coli data page lists these counts for water flowing into and out of Winona Lake, in CFU per 100 mL: Cherry Creek 1,119.9; Keefer-Evans Ditch 579.4; Peterson Ditch 365.4; and Eagle Creek, the lake's outlet, 7.5. The same page states that the EPA's safety threshold is 235 CFU per 100 mL. These figures describe water in the channels on one sampling date; a beach status comes from separate beach samples, and the numbers change with every sampling round. Check the live page for current results. Checked October 5, 2026.
On that date, all three inflows measured above the threshold the page cites while the outlet measured far below it. A single round of samples proves nothing on its own, but the pattern shows why the inlets deserve the attention: they are where whatever the watershed sheds arrives first, in concentrated form.
Between sampling rounds, you can watch the inlet and outlet streams respond to a storm in near real time through the public stream monitor on Xylem's HydroSphere platform. Pull it up during the next heavy rain and you can see the flow change while the storm is still overhead.
What changes in the lake
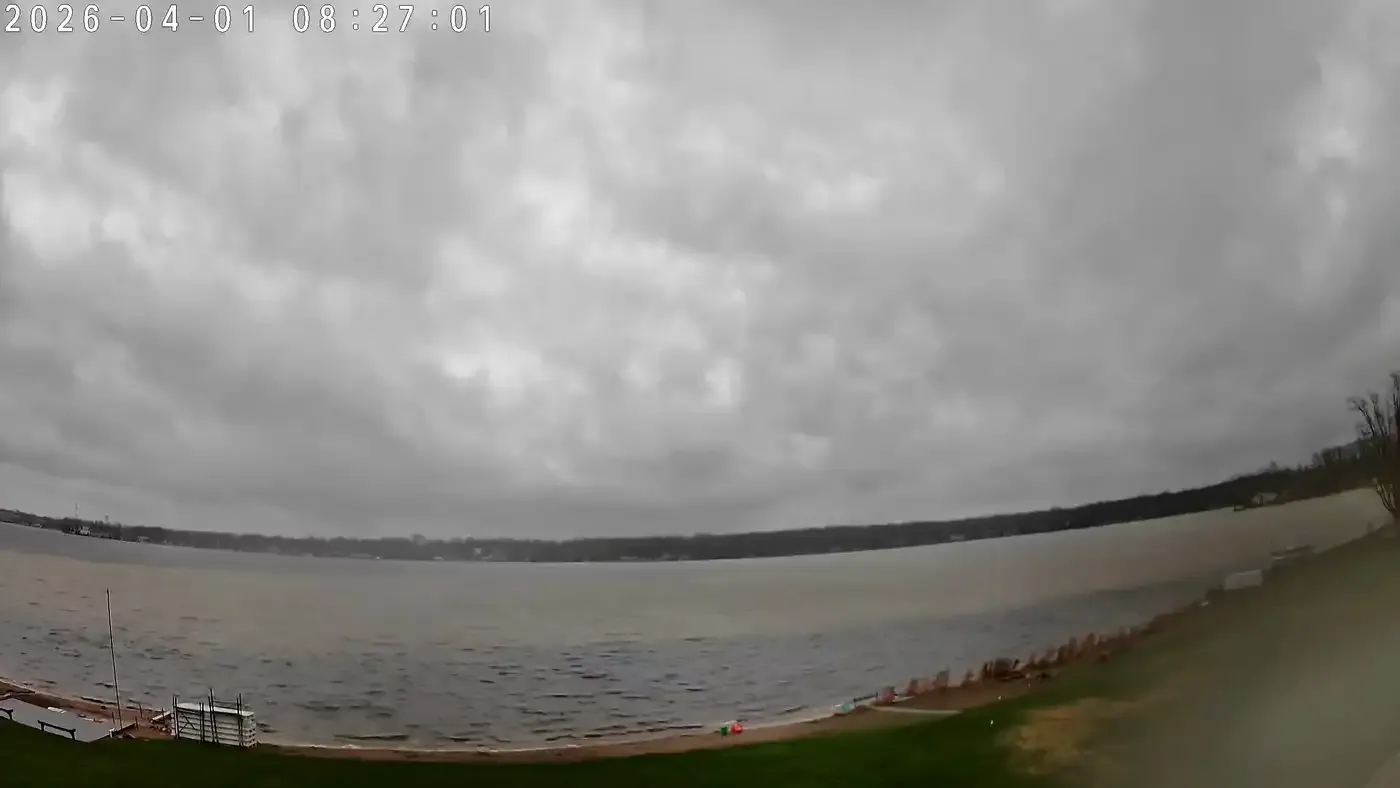
Sediment shows up first. Near the inlet mouths, especially on the southwest side where Peterson Ditch comes in, the water can turn cloudy while the fine soil settles out. That cloudiness fades over days as the particles drop to the bottom.
The nutrient pulse works on a slower clock. Phosphorus that arrives bound to storm sediment becomes fuel for algae growth later in warm weather, which is why a June storm can matter to an August lake. This delayed connection between runoff and algae is the reason so much local stewardship work, including the Peterson Ditch streambank projects, aims at keeping soil out of the water in the first place.
Bacteria are the change with the most direct effect on people. Because rain moves animal waste into the nearest water, bacteria counts at beaches can rise after storms. That is one reason swimmers should check the latest data before heading to the beach; is Winona Lake safe to swim in? walks through where the current beach and algae numbers live and how to read them.
The idle-speed advisory for boaters
Heavy rain can also change the rules on the water. When rainfall pushes lake levels high, the Indiana DNR issues temporary idle-speed advisories on Kosciusko County lakes, because boat wakes on high water can push waves into shoreline yards and homes. During an advisory, the whole lake is idle speed, which Indiana law defines as the slowest possible speed, not exceeding 5 mph, that maintains steerage with minimal wake.
On an ordinary day, idle speed is only required within 200 feet of the shoreline under IC 14-15-3-17; an advisory extends that pace everywhere. The site's boating lap page covers the everyday 200-foot rule and the loop it draws around the lake.
How to watch a storm move through
The full cycle, from forecast to sample results, is visible from home.
- Before and during the storm: the hourly forecast at weather.winonalake.org and the conditions dashboard on Lake Today show what is coming and how hard it is falling.
- In the streams: the Xylem inlet and outlet monitor shows the flow responding within hours.
- In the following week: the Lilly Center's E. coli data page posts the next round of stream and beach samples, updated weekly.
- On the surface: the timelapse cameras record what the lake itself looked like while all of this happened.
What you can do at home
Every lot in the watershed contributes something to the next storm's runoff, and a few habits shrink that contribution.
- Keep storm drains clear. Leaves, grass clippings, and trash swept into a drain ride the next rain straight toward the lake.
- Use phosphorus-free fertilizer, and time it. The DNR's Living With Lakes guidance recommends phosphorus-free fertilizer and advises against fertilizing before heavy rain, when the application washes off instead of soaking in.
- Pick up pet waste. The Lilly Center's explainer lists it among the sources rain carries to the nearest water.
- Stabilize bare soil. Exposed dirt from projects or worn lawns erodes in every downpour; cover it with seed, mulch, or plantings.
- Plant natives near ditches and shorelines. Native plant roots filter runoff and hold soil in place, which is why buffer strips at the water's edge are a standard recommendation from both the Lilly Center and the DNR. The stewardship page lists the local organizations doing this work at larger scale.
Before you go
After the next heavy rain, expect cloudy water near the inlets for a few days, know that the beach numbers may move, and watch for a temporary idle-speed advisory before running the lake at speed. All of it can be followed from home: the forecast on Lake Today, the stream flow on the Xylem monitor, the sample results on the Lilly Center's data pages, and the surface itself on the timelapses.
Support the organizations in this article
The monitoring and research behind this article are the work of the Lilly Center for Lakes & Streams at Grace College, which accepts gifts toward its research and education. The Watershed Foundation funds and builds the upstream projects that protect the lake; it accepts a one-time donation or a monthly gift.
More about the local organizations, and other ways to help, is on the stewardship page.
Sources
- Lilly Center for Lakes & Streams E. coli data. The October 1, 2026 stream samples, the sampling cadence, and the EPA threshold the page cites. Checked October 5, 2026.
- Lilly Center E. coli explainer. The rain-and-animal-waste quote and the list of bacteria sources. Checked August 17, 2026.
- Lilly Center Winona Lake profile. The 18,730-acre watershed figure and the lake's inlets and outlet. Checked August 17, 2026.
- Xylem HydroSphere public site. The live stream monitor for the lake's inlets and outlet. Checked September 1, 2026.
- Indiana DNR, Living With Lakes. Fertilizer timing and native shoreline planting guidance. Checked August 17, 2026.
- weather.winonalake.org. The live hourly forecast for the lake. Checked August 17, 2026.